

BNP Paribas’ QIS Lab’s recent research into network-based portfolio analysis, recently published in the Journal of Portfolio Management, reveals how several network and clustering approaches are applied to a broad investment universe.
Key Research Takeaways
• Financial networks expose hidden concentrations and diversification breakdowns.
• Market stress can tighten connections and weaken conventional diversification.
• Network visualisation and clustering identify central exposures and diversifiers.
Delivering a clearer view through network-based portfolio analysis and clustering
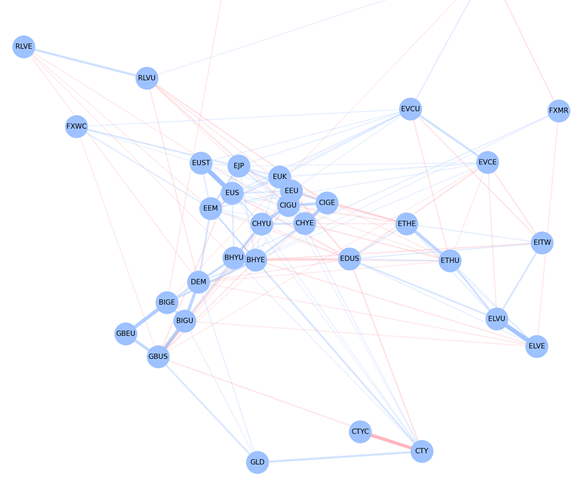
Portfolio managers are constantly looking for tools that go beyond the traditional correlation matrix to surface hidden concentrations and stress‑induced linkages. Recent research from BNP Paribas’ Quantitative Investment Strategies (QIS) Lab shows that network‑based portfolio analysis – leveraging graphical models, minimum spanning trees – alongside clustering techniques (specifically spectral clustering), delivers a clearer, more actionable view of asset interrelationships.
Network and graph‑based methods can reveal hidden portfolio dependencies, central risk exposures, and diversifying strategies that traditional correlation matrices may obscure.
More advanced network approaches reveal direct relationships among assets after accounting for broader market effects and help identify central risk exposures, as well as genuinely diversifying strategies. The research also compares graph-based clustering methods with more traditional distance-based approaches and shows how different techniques produce economically meaningful groupings of assets and strategies. The results suggest that graph-based approaches, particularly spectral clustering, can provide useful insights for portfolio construction, diversification analysis, and risk monitoring.
When do these insights matter most for portfolio managers?
- During market stress and rising cross asset connectivity;
- When reviewing diversification across large multi-asset universes;
- When identifying hidden common exposures or peripheral diversifiers;
- When comparing clustering approaches for portfolio structure.
The research also raises several discussion points and goes on to provide some insightful and practical guidance on implementation and measurement.
The bottom line for network-based portfolio analysis
Correlation matrixes can hide how risks are connected across a portfolio. Network-based views can make those relationships easier to see, especially as they change under stress. These tools should be used to complement – not replace – traditional correlation analysis when assessing diversification and concentration.
You can also access the full research findings by going to the Journal of Portfolio Management. Alternatively, if you are a BNPP client with access to Brio you can access the report here.
FAQs
What is network‑based portfolio analysis?
It is a set of techniques that model a portfolio as a graph where nodes are assets and edges represent dependencies, allowing managers to visualise and quantify hidden risk concentrations.
How does spectral clustering differ from traditional clustering?
Spectral clustering uses the eigen‑vectors of the graph Laplacian to partition assets based on the structure of their connections, often yielding more economically meaningful groups than distance‑based methods.
Why use the graphical lasso instead of a plain correlation matrix?
The graphical lasso produces a sparse precision matrix that isolates direct, conditional relationships between assets, filtering out spurious links that arise from common market factors.
Can network analysis replace traditional risk metrics?
No. It should be used as a complementary view that highlights hidden structures, while standard risk metrics (VaR, volatility, beta) remain essential for quantitative assessment.
Where can I find the full research findings?
The full paper, Network Science, Graphical Models, and Clustering for Portfolio Managers, is published in The Journal of Portfolio Management (Quantitative Tools 2026). And you can also access it here if you are a BNP Paribas client with access to Brio.
Notes:
The Journal of Portfolio Management is a quarterly academic journal for finance and investing, covering topics such as asset allocation, performance measurement, market trends, risk management, and portfolio optimisation.
QIS Lab: Bridging the gap between academia and BNP Paribas Quantitative Investment Strategies Group, the QIS lab is dedicated to developing cutting-edge systematic strategies, such as foundations of factors investing, new strategies, research in asset allocation through systemic strategies.