Methodology and investor profile
In May, BNP Paribas’ Capital Introduction Group surveyed 29 allocators on their alternative UCITS allocation to obtain a snapshot of investor sentiment in the industry.
UCITS (Undertakings for Collective Investment in Transferable Securities) is the European Union’s framework for managing investment vehicles allowing investment managers to market across the EU without restrictions.
For the purpose of this survey, “alternative UCITS” refers to absolute return strategies (including hedge fund and alternative beta / risk premia strategies) run within a UCITS compliant framework. “Hedge fund assets” may include assets invested in hedge fund, alternative UCITS, alternative 40 Act and alternative beta / risk premia strategies.
Our survey respondents collectively invest or advise on $110 billion of hedge fund assets and $15 billion of alternative UCITS assets. The mean hedge fund AUM of our respondents is $3.8bn (median: $600m) and the mean alternative UCITS AUM is $522m (median: $125m).
On average, respondents allocate 33% of their hedge fund book to alternative UCITS. Respondents are roughly evenly split in terms of investor type between intermediaries (defined as fund of funds, outsourced investment offices and investment consultants) and private investors (defined as family offices and private banks / wealth managers).
The alternative UCITS landscape
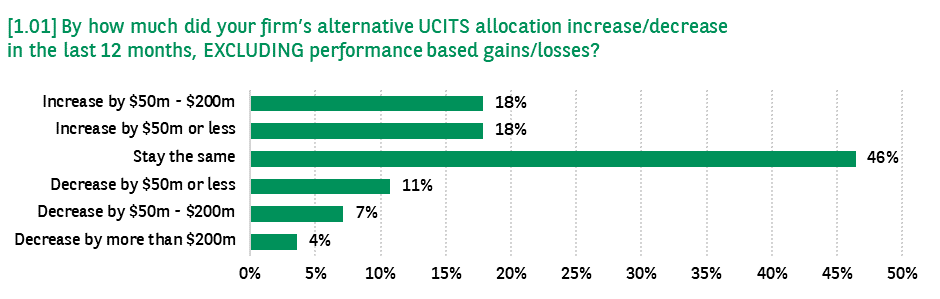
In the last 12 months, 36% of this investor group increased their alternative UCITS allocation while 22% decreased it [graph 1.01]. The total net increase to the alternative UCITS space by this investor group in the year preceding was $225m.
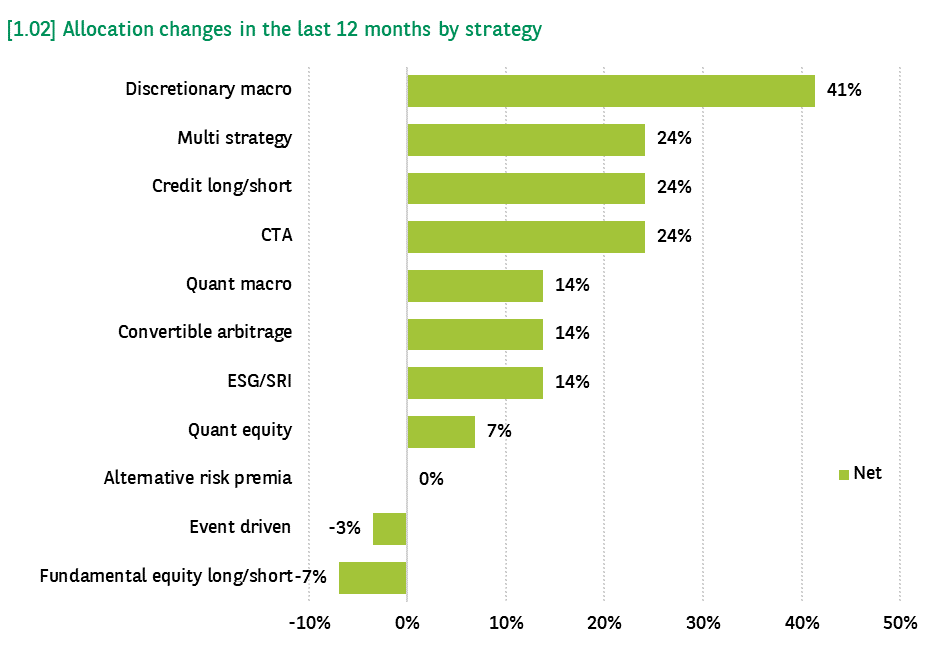
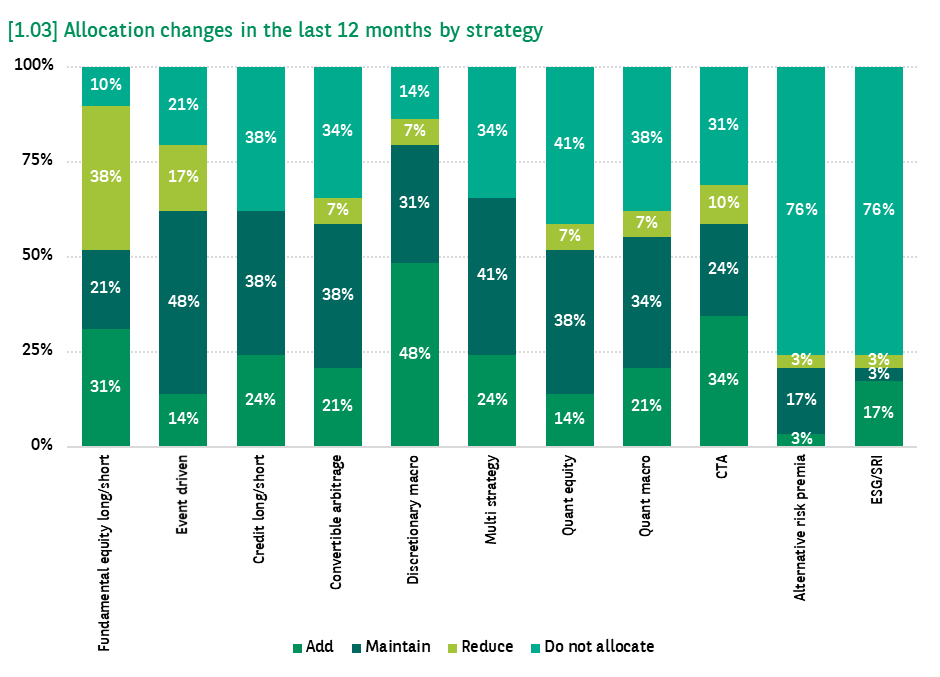
By strategy, Discretionary macro saw the highest net demand from this investor group with 41% adding to the space. Multi strategy, Credit long/short and CTA also saw strong demand with almost a quarter (24%) of respondents adding in the last 12 months. Fundamental equity long/short and Event driven on the other hand saw outflows from this investor group on a net basis; 7% and 3% of respondents redeemed from these strategies, respectively [graph 1.02].
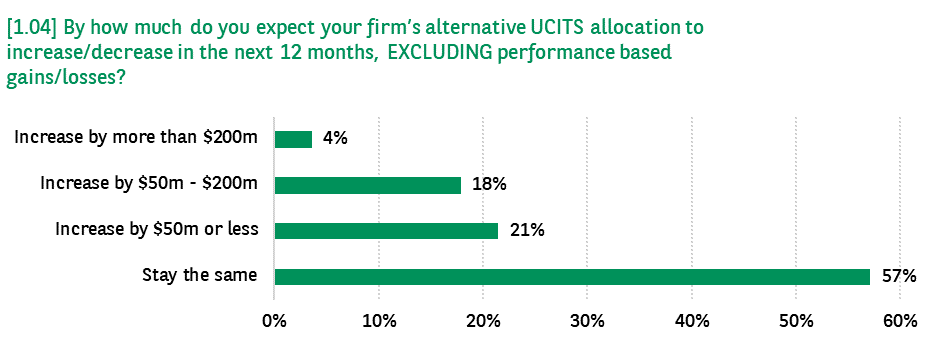
For the next 12 months, 43% of responding investors are planning to add to their alternative UCITS allocation and none are looking to reduce [graph 1.04]. The aggregate inflows to the alternative UCITS industry from this group comes to $1.34 billion, which is six times more than they added in the previous 12 months.
However, when dissecting this significant increase, we note that half is driven by two investors with their own UCITS platforms, suggesting that the majority of this capital will be allocated to only two to three managers.
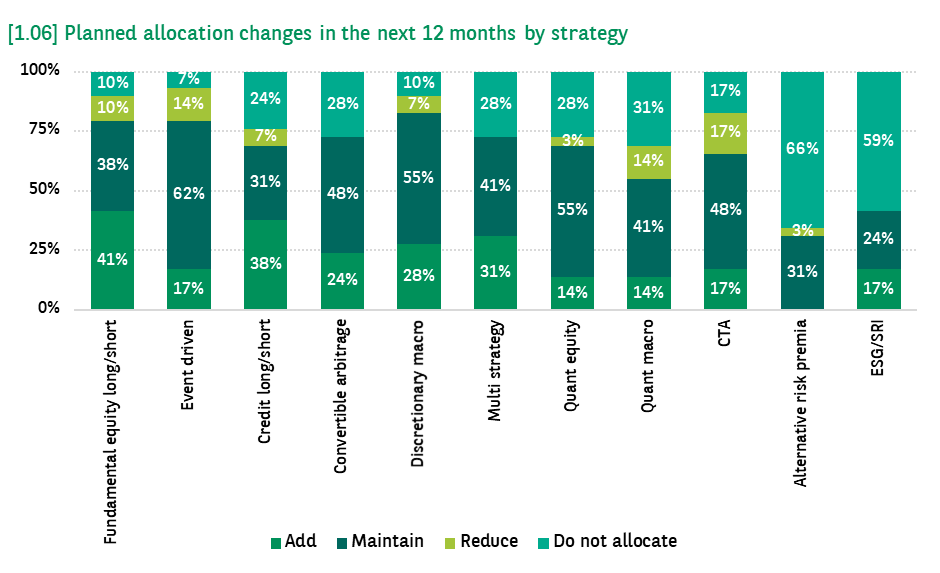
Multi strategy, Credit long/short and Fundamental equity long/short are set to see the strongest demand for the year ahead from this investor group, with 31% of respondents looking to add on a net basis [graph 1.05]. This falls in line with our Alternative Investment Survey from earlier in the year which looks at allocation plans across the whole hedge fund space where Credit and Equity long/short also topped the charts for demand per strategy.
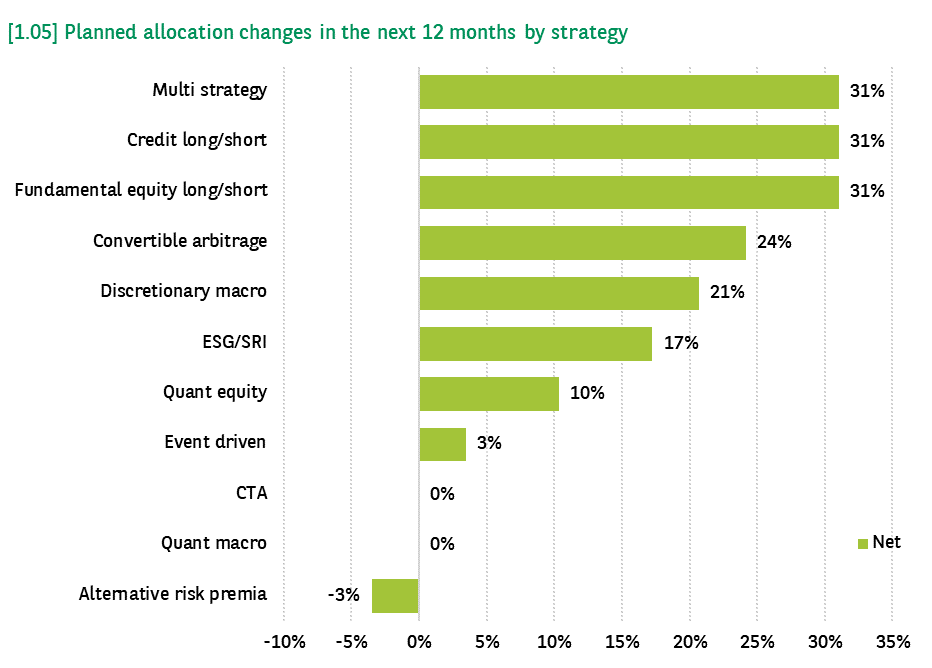
Demand for Fundamental equity long/short in the alternative UCITS space is u-turning as investors reduced their exposure on a net basis in the last 12 months, but are looking to increase in the following year. 2022 saw a difficult equity market environment with major indices being down double digits for the calendar year (Source: Bloomberg). In a UCITS vehicle, which typically has daily or weekly liquidity, investors are able to be tactical; the data suggests investors are timing their shifts in and out of equity strategies.
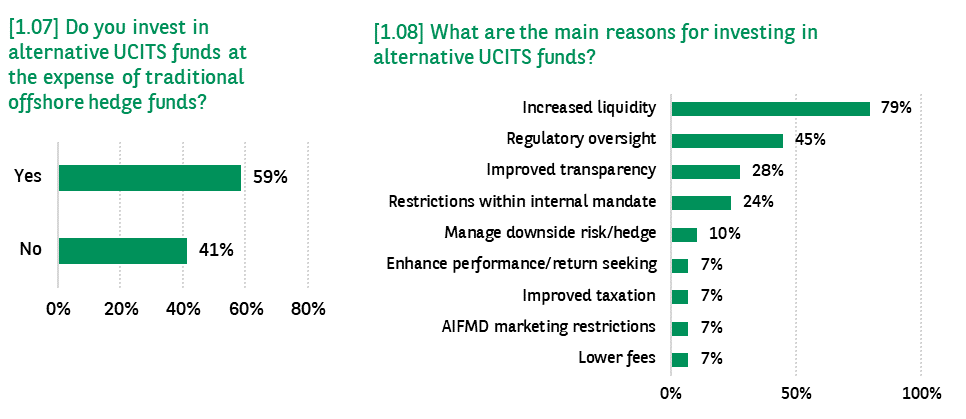
With regards to how alternative UCITS strategies fit within their overall hedge fund portfolio, the majority of allocators (59%) said they invest in alternative UCITS at the expense of their traditional hedge fund portfolio [graph 1.07] and the overwhelming motivation is increased liquidity [graph 1.08].
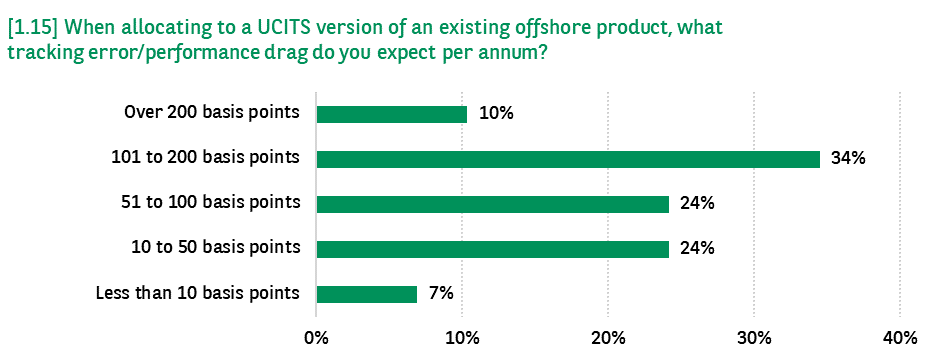
Given this trend, we asked investors what tracking error they tolerate for alternative UCITS products that replicate an offshore product. More than half of responding investors (55%) expect a tracking error of 100 basis points or less [graph 1.15].
The average Total Expense Ratio (TER) (defined as total cost associated with managing and operating an investment fund, including management fees and additional expenses but not performance fees) paid by this investor group for their alternative UCITS portfolio is 1.36%.
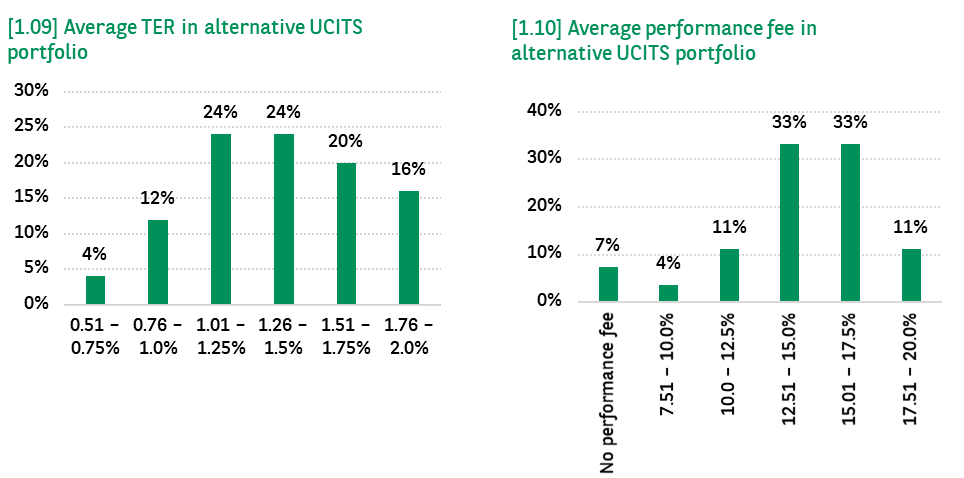
The average performance fee reported by respondents is 13.66%. This compares to the average performance fee reported by investors in our Alternative Investment Survey this year, for their whole hedge fund portfolio, of 16.91%.
Almost two thirds of respondents (69%) target 5% or better return for their alternative UCITS portfolio, whilst only 17% achieved this in 2022 [graph 1.11]. The average 2022 realised return for our respondents’ alternative UCITS portfolios was 1.16%, in line with the 2022 realised return reported by respondents in our Alternative Investment Survey for their overall hedge fund portfolios.
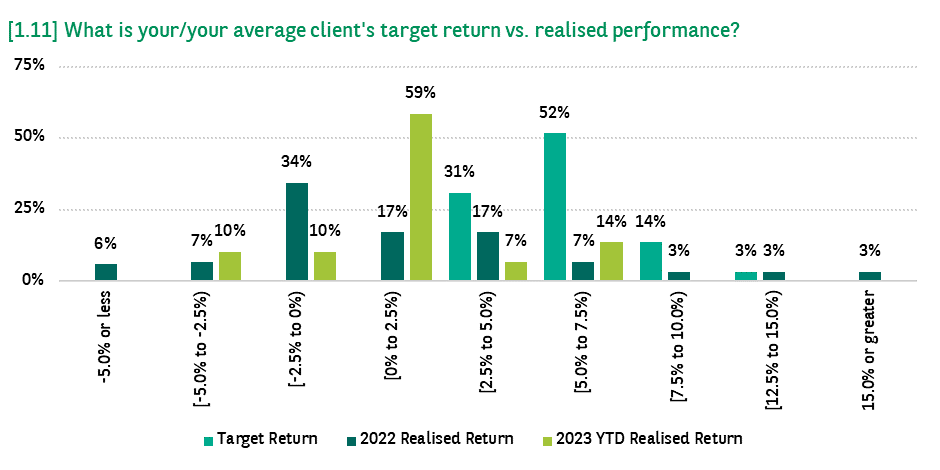
Although investors’ hedge fund portfolios fell short of their return targets last year, they meaningfully outperformed equity and credit markets which were down double digits (Source: Bloomberg).
This investor group’s alternative UCITS portfolios also outperformed the alternative UCITS industry index last year which was down 2.2%. Year to date during May, survey respondents reported an average return of 1.34% roughly in line with the industry index which was up 1.10% to the end of April.
The average target return reported by our survey respondents for their alternative UCITS portfolio is 5.99%. Alternative UCITS products are subject to stricter investment constraints than traditional offshore hedge funds, as such their return targets are typically lower.
Respondents to our Alternative Investment Survey this year reported return targets for their overall hedge fund portfolio to be 8.22%, 223 basis points higher than the alternative UCITS portfolio target return of this survey’s respondents. However, since the risk free rate has soared to around 5%, we are interested to see at what point investors reconsider their return targets for their Alternative portfolios.
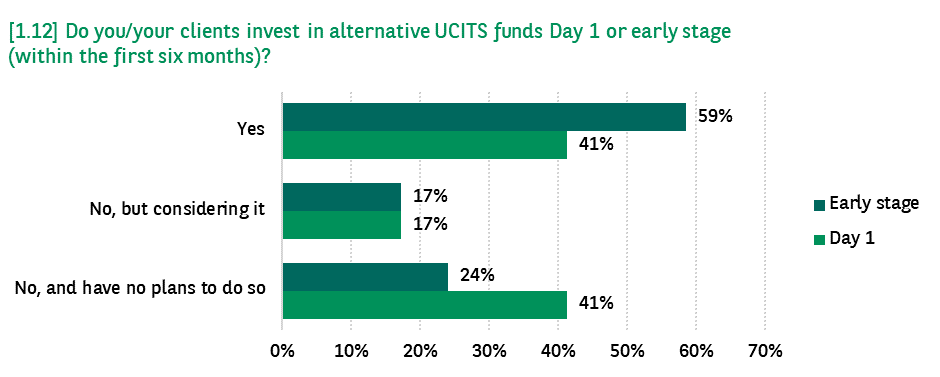
Most investors (59%) that participated in our survey invest early stage in alternative UCITS managers [graph 1.12], often because the strategy is already run in a different structure therefore overcoming the minimum AUM and track record for some investors.
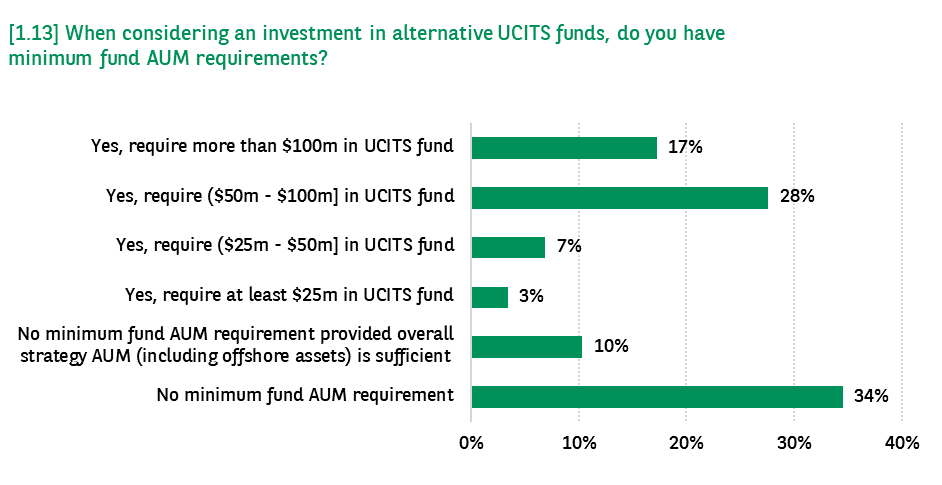
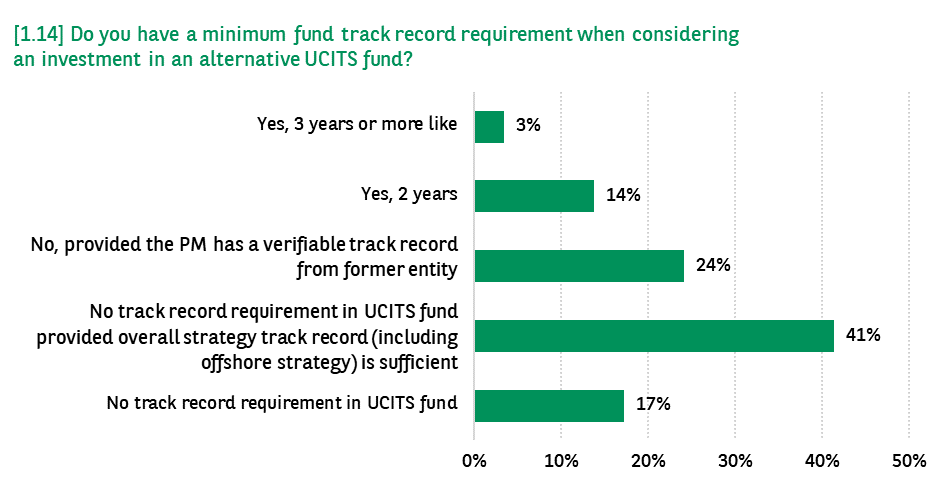
Just over a third of responding investors do not require a minimum fund AUM in order to invest in an alternative UCITS fund, and a further 10% do not require it as long as there is sufficient strategy AUM [graph 1.13]. 83% of responding investors do not require a track record in the alternative UCITS fund where often a verified track in a different entity suffices [graph 1.14].
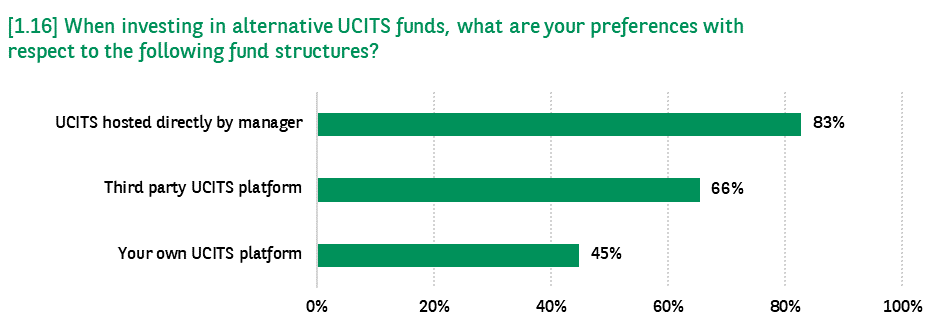
We asked investors how they prefer to access alternative UCITS funds, either through: third party UCITS platforms; their own UCITS platform or; UCITS funds hosted directly by the manager. Unsurprisingly, funds hosted directly by the manager is the most popular way to access UCITS products given this facilitates a more streamlined operational due diligence.
Running their own UCITS platform would come with higher direct costs to the investor, nevertheless almost half (45%) of respondents do this [graph 1.16]. Notably, the vast majority of investors with their own UCITS platform do not rule out investing through other means, with only 10% reporting they exclusively invest through their own platform.